Say what you will about the "debate" on global climate change, but we're here to talk data and facts.
Atmospheric carbon dioxide -- exactly like it sounds, the level of CO2 in the atmosphere -- reached another record earlier this month.
According to hourly and daily averages from the National Oceanic and Atmospheric Administration (NOAA), the peak level of CO2 measured in a day reached a new record -- 421 ppm (parts per million).
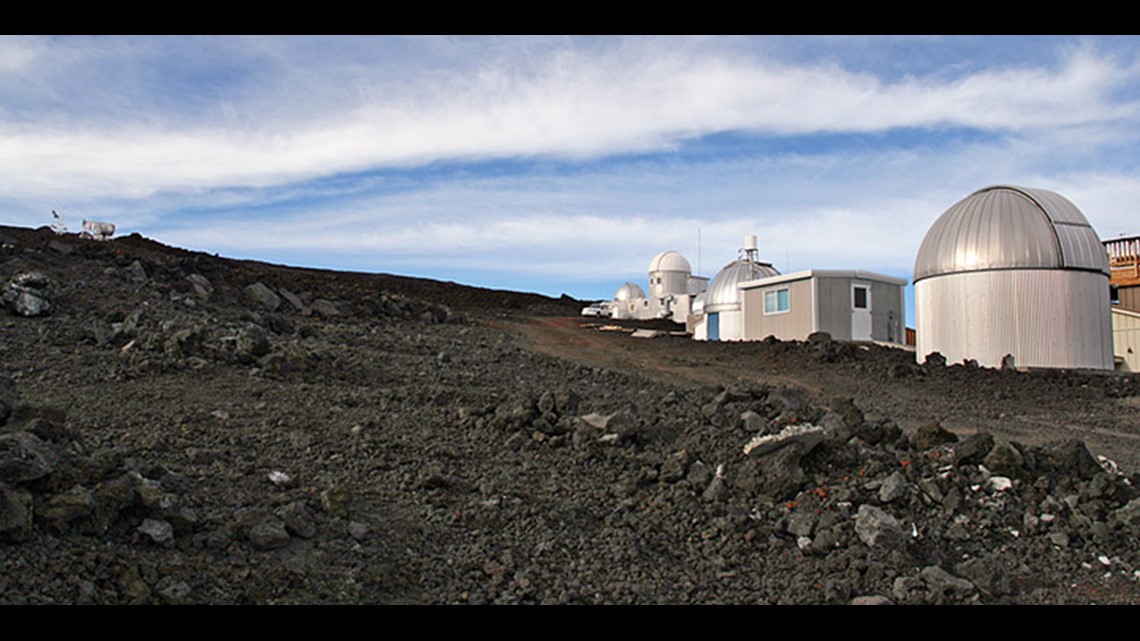
The measurement takes place at Mauna Loa in Hawaii.
Mauna Loa, you ask? Isn't there a volcano there? Why there? Of course the levels are higher there!
Not true. While Mauna Loa is indeed an active volcano (it last erupted in 1984), the observatory is located on the northern side of the mountain, four miles away and 2,600 feet below the summit. According to the NASA Earth Observatory, they experience baseline conditions of CO2 and adjust accordingly.
Given that Hawaii is one of the most isolated island chains on Earth, the air surrounding Mauna Loa measures some of the cleanest air in the world.


It's been over the Pacific Oceans for days, even weeks at times. On rare occasions does the observatory detect volcanic CO2 from the summit due to local weather conditions, and they know to throw that data out.
And on top of that, NOAA's Earth Science Research Laboratory program measures CO2 at over 60 remote locations around the world. The Mauna Loa measurements meet the par for the course.
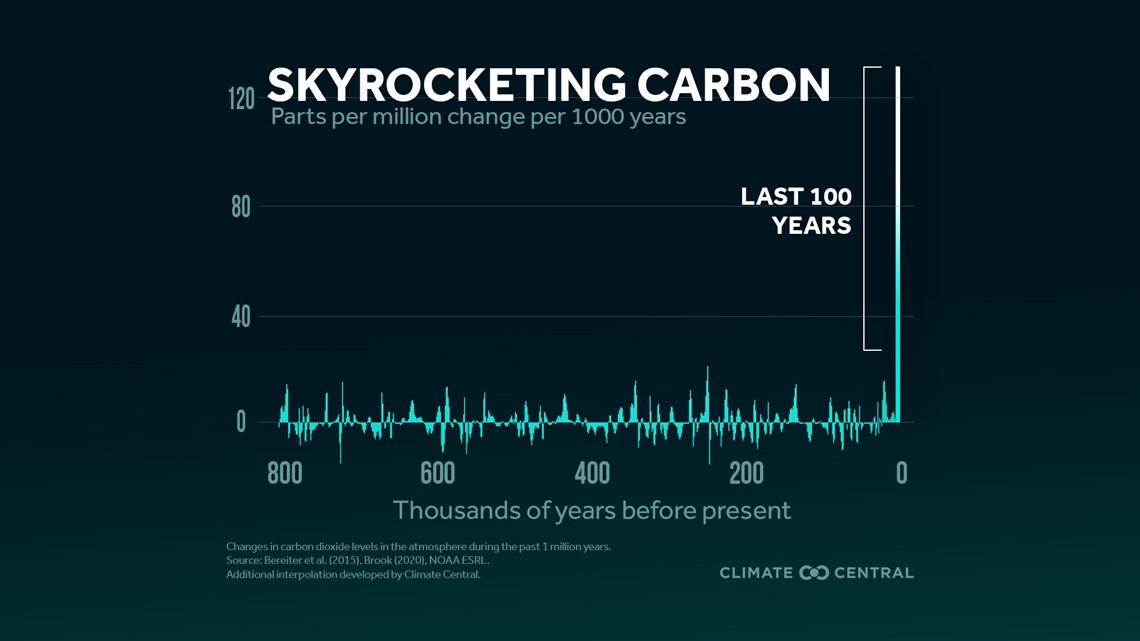
Back to the new record. It's not just about the ppm. It's about how quickly we've gotten there. And that's where I introduce to you the Carbon Skyscraper.


The above graph focuses on the rate of change of CO2 over the last 800,000 years. Thanks to paleoclimatology (don't worry, here's your definition) we can glance back at Earth's history to see what CO2 levels were and when.
And the elephant in the room here is the last 100 years, we've seen a spike in that graph like never before in the previous 800,000 years.
Why? The only difference between the relative norm of 799,900 years and the last 100, is us.
The last time CO2 levels were around this range was more than 3.6 million years ago (after a meteorite impact), when the temperature was more than 7°F warmer and sea levels were about 78 feet higher.
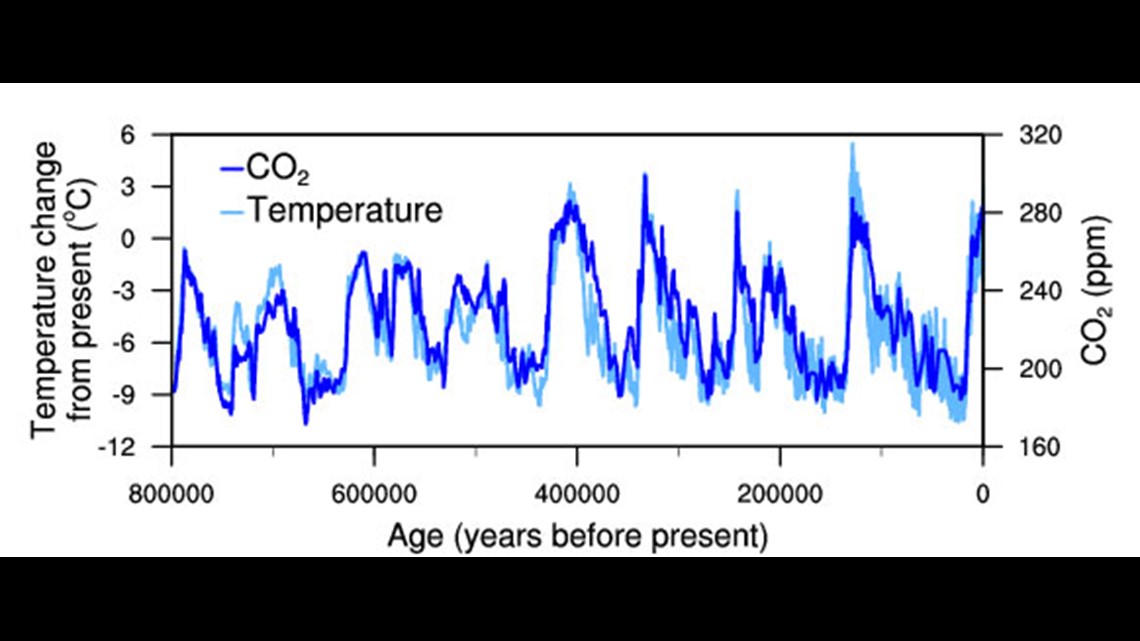
And we know from natural rises and drops in carbon, there have been documented rises and falls in temperature. Yes, this is where the argument "this naturally happens," is true.


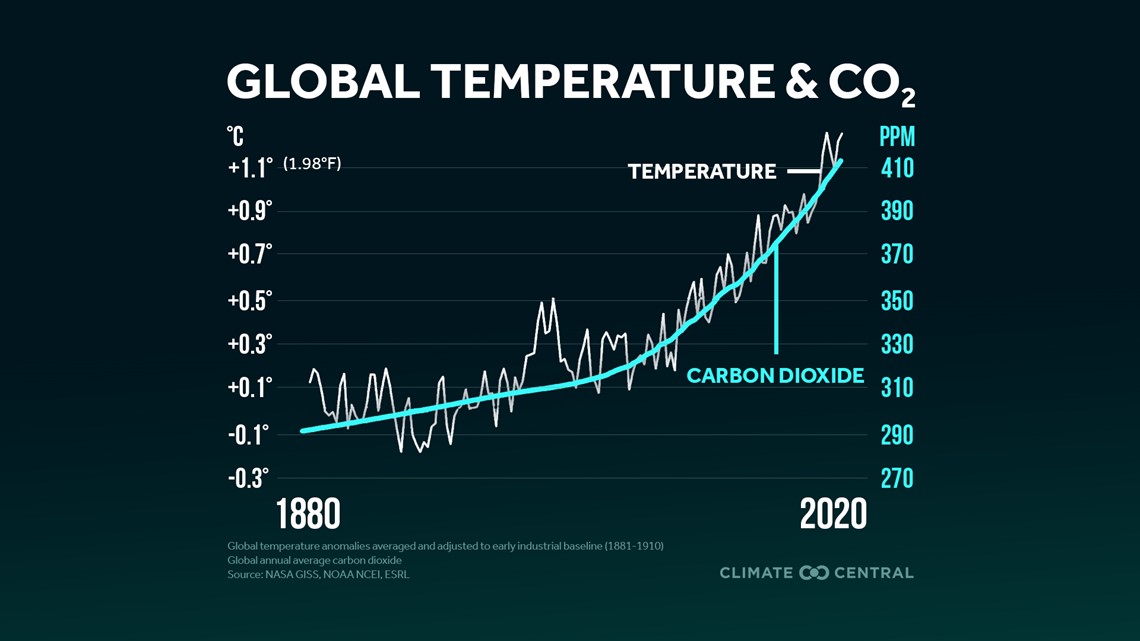
You can see it in the data... that dates back to before the last 130 years. Before the huge rise in the Carbon Skyscraper. The effects contribute again to a rise in global temperature since 1880 when compared to where we should be historically. In this spike, there is no ice age, no meteorite strike or super volcanic eruption to explain the quick rise. It's only our own increased use of CO2-producing products and facilities.


And it's this rate of increase that has no known rival in Earth's history. We haven't warmed this much, this quickly, in this short of time frame (save a meteorite strike). So far, we're sitting at 1.2°C warmth in the last 130 years. The Paris Climate Agreement set a goal of stopping that warming at 1.5°C by 2030.
In future blogs, we'll discuss what happens at 1.5°C and 2°C of warmth, detail more of the goals of the Paris Climate Agreement and overall human impact on the global rise in temperature.
But for now, we simply examine the data as it comes in with a new record set. Digest it. If you have questions, you can send me a message on social media or an email at blong@fox43.com.
Until next time,
-Chief Meteorologist Bradon Long
This blog was written with graphics and data provided by Climate Central, NOAA and NASA.


