PENNSYLVANIA, USA — It's already starting to feel like winter in central Pennsylvania!
As we approach the start of meteorological winter, Dec. 1, it's time to take a look at what the season will bring in terms of temperature and snowfall.
There's a lot that goes into a long range winter forecast! To create the forecast, the FOX43 Weather Team looked at a few parameters:
1. Long term trends
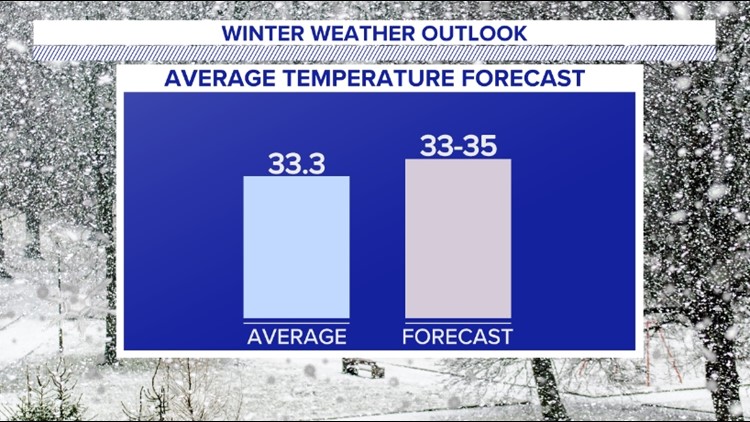
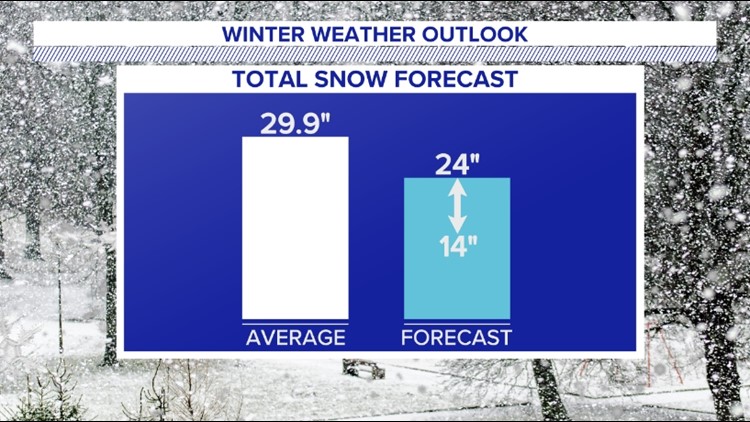
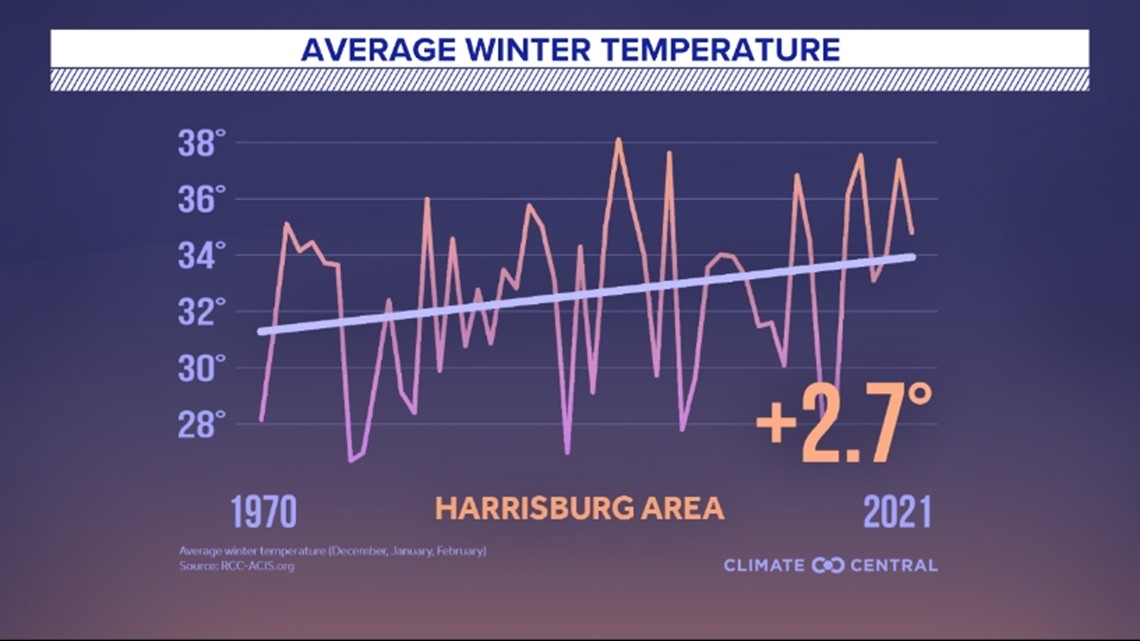
It's important to look at long term trends when it comes to winter forecasts. Harrisburg's 30-year average seasonal snowfall is 29.9 inches and its average winter temperature is 33.3 degrees.
However, with a warming climate, we've seen snowfall totals slowly trend downward. We've also seen temperatures slowly climb. In fact, since 1970, Harrisburg has seen an increase in its average winter temperature by 2.7 degrees, according to Climate Central.

2. Global ocean and weather patterns
Along with long term trends, it's important to look at global ocean and weather patterns that can give clues as to what will happen in our region.
One of those trends that you've probably heard before is La Niña, which is a cooling of the waters along the equatorial pacific.
The cool waters lead to a more active northern branch of the jet stream, which tends to bring weak systems originating from the Pacific that track to our north and west.
This year marks the third consecutive winter with La Niña conditions. Current forecasts have this pattern turning more neutral by the spring.

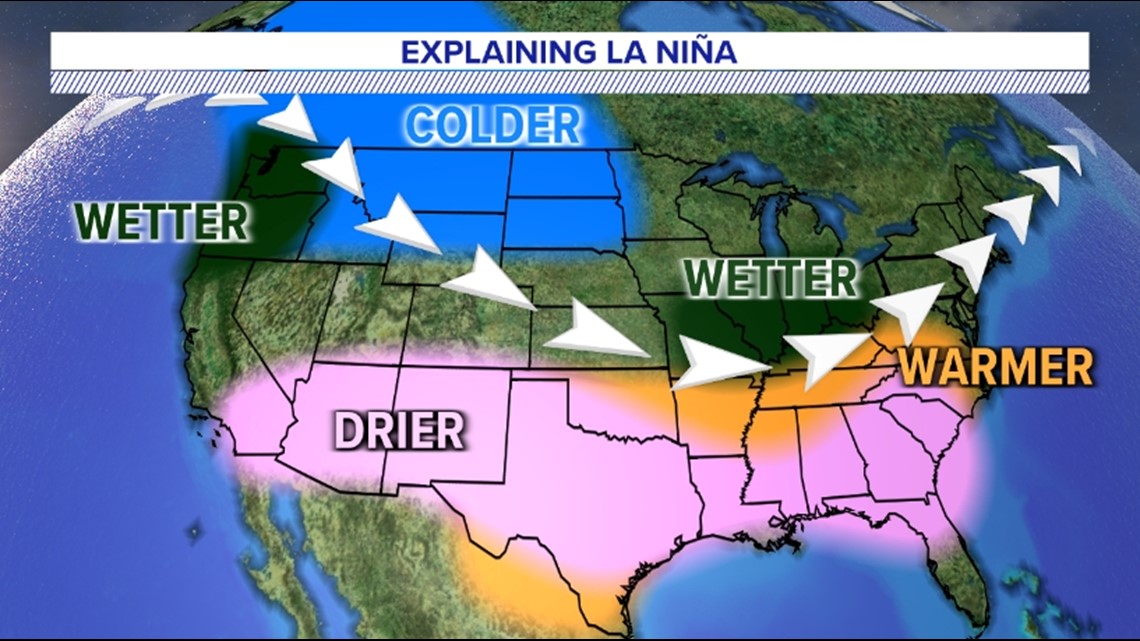
Another pattern we look at is the Pacific Decadal Oscillation. This weather pattern has been in a negative phase for years now, which favors cooler and rainier conditions in the western US. For the eastern half of the nation, it's the opposite, according to Kyle Elliot, weather information center director at Millersville University.
“We have warmer, less stormy, and drier conditions in the Eastern U.S.," Elliot tells us.
Another factor that we hear about often in the winter is the Polar Vortex.
"When the Stratospheric Polar Vortex, or SPV, is strong, typically the cold air in the low levels of the atmosphere stays bottled up near polar regions," Elliot said. "When that stratospheric vortex becomes weak and breaks down, that's when some of that arctic air gets dislodged"
Currently, the polar vortex looks to be weaker for the first half of the winter and a stronger polar vortex is more likely for the second half.
3. Analog years
Finally, we also looked analog years, which is a fancy way of saying we looked at years with similar environmental setups and how both temperature and snowfall were impacted. The years we looked at include: 1956-1957, 1975-1976, 1985-1986, 1999-2000, 2000-2001, 2011-2012 and 2021-2022.
It's worth mentioning that only two of the years sampled were true, third-year La Niñas, or "triple dips." Those are the winters of 1975-1976 and 2000-2001. The other years were second-year La Niñas, but we learned from Kyle Elliott that second- and third-year La Niñas behave similarly. First-year La Niñas can be variable because the pattern isn't as well-established as the second year, or especially the third year.
We also learned that it's best not to go too far back when picking analog years. Best practice is not to go past 30 years. Climate change has impacted us so much over the past century that our current climate is much different than it was even 40 or 50 years ago. This means these patterns behave a little differently too, and that includes their impacts for us.
So why look at 1956-1957 and 1975-1976?
Since this is the Weather Smart Team's first go at a winter weather outlook, we wanted to see if it would change our decisions, especially since 1975-1976 was the first third-year La Niña in the books. In this case, the answer is no.
However, in more neutral-leaning years, we were advised that this would not be the case. In fact, in more neutral-leaning years, the expectations aren't as definitive as third-year La Niñas and can often be quite variable.
The forecast
So, what's our forecast for the upcoming winter? We're forecasting a winter with temperatures near to slightly above normal, along with below average snowfall for the season.
In Harrisburg, our average winter temperature—which spans from Dec. 1 to Feb. 28—is 33.3 degrees. We're forecasting an average temperature of 33 to 35 degrees.
When it comes to snowfall, Harrisburg averages 29.9 inches of snow. We're forecasting below average snowfall, with a range of 14 to 24 inches.
We're also going to give a bold forecast for a few locations in the area!
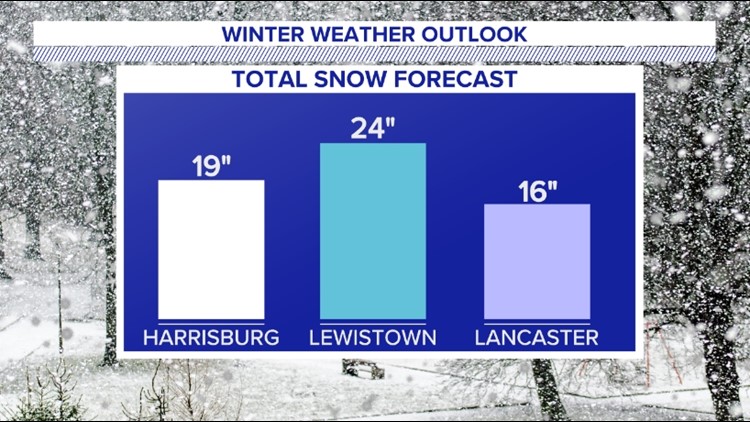
For Harrisburg, we're giving a bold forecast of 19 inches. Of course, areas in higher elevations tend to see more snow! So we're giving a bold forecast of 24 inches to Lewistown. Further southeast, we typically see more mixing, so we're giving a bold forecast of 16 inches to Lancaster.
FOX43 Winter Outlook 2022-2023
We'll check back in at the end of the season to see how the forecast pans out!

